What Matt Levine writes about (or, The Rise and Fall of WeWork and GameStop)
There exists a fantastic newsletter called Money Stuff by this brilliant writer called Matt Levine. I seriously cannot overstate how much I love reading it – it’s truly amazing. It’s not just me, lots of other people like it too. You should read it!
Recently, I was idly wondering about the topics Matt Levine writes about in Money Stuff. I thought it would be interesting to see because of how they sort of reflect trends in Finance news. I had some free time on my hands in between jobs and I decided to find out!
Results
I looked at 290 articles, from October 2019 to July 2021. They have a total word count of ~1.2 million (!) and an average per article of ~4100.
To start with, here’s my favourite plot from the exploration (and the one that gives the post its name). It’s a heatmap of the top 10 topics 1, 2 in Money Stuff by month, from October 2019 to July 2021.
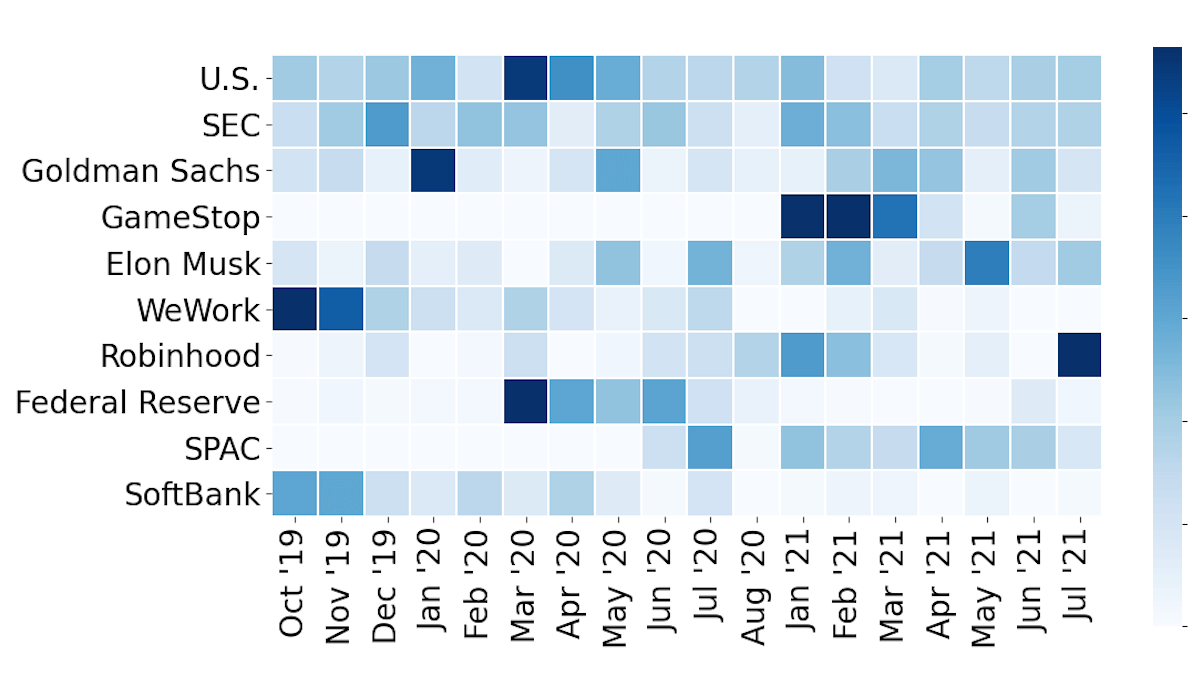
I think it’s particuarly interesting to see how WeWork was a hot topic at the end of 2019 and then slowly became less important and how GameStop was never mentioned before Jan 2021 (and SPACs before June 2020).
Okay, actually, that’s not my favourite plot. My favourite plot is the one below with nearly 25 “top” topics with some filtering. However, it has too much information and doesn’t work well especially on smaller screens, but why not include it anyway (click/tap to open image in new tab):
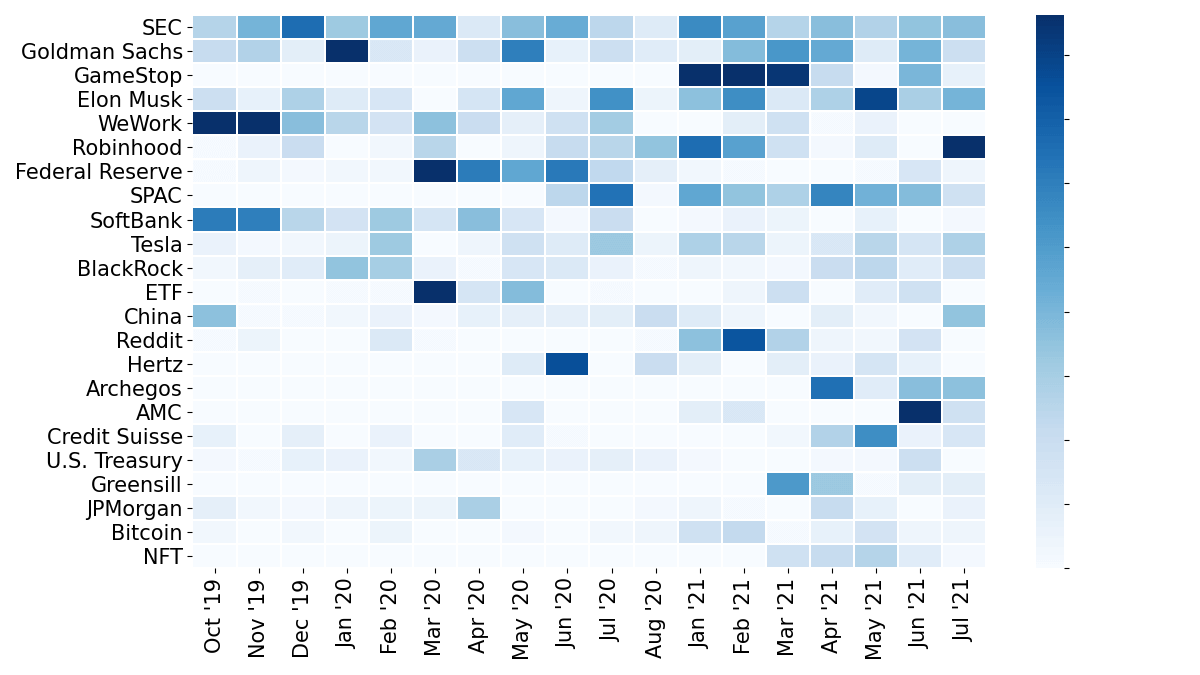
This one has other interesting topics like Reddit (probably because of r/WallStreetBets), Hertz (because of the bankrupty and unexpected share price moves), Archegos (the default), and NFTs.
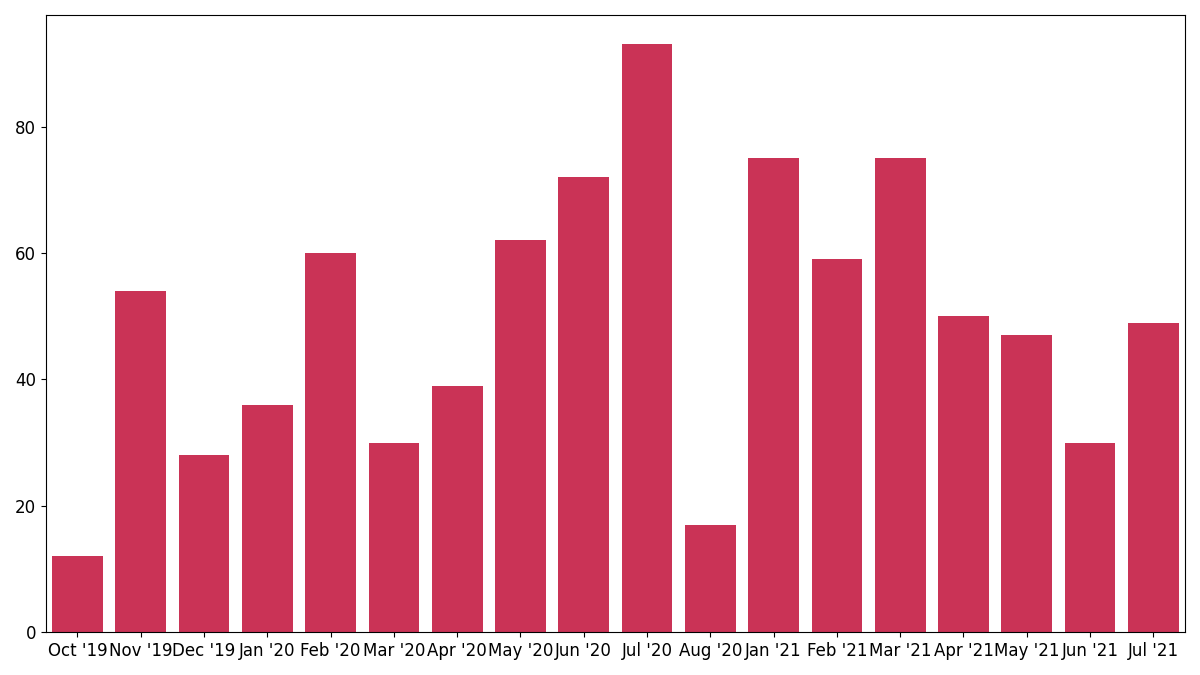
As Matt Levine likes to say, “Everything is securities fraud”, so here’s how many times he mentions the word “fraud”:
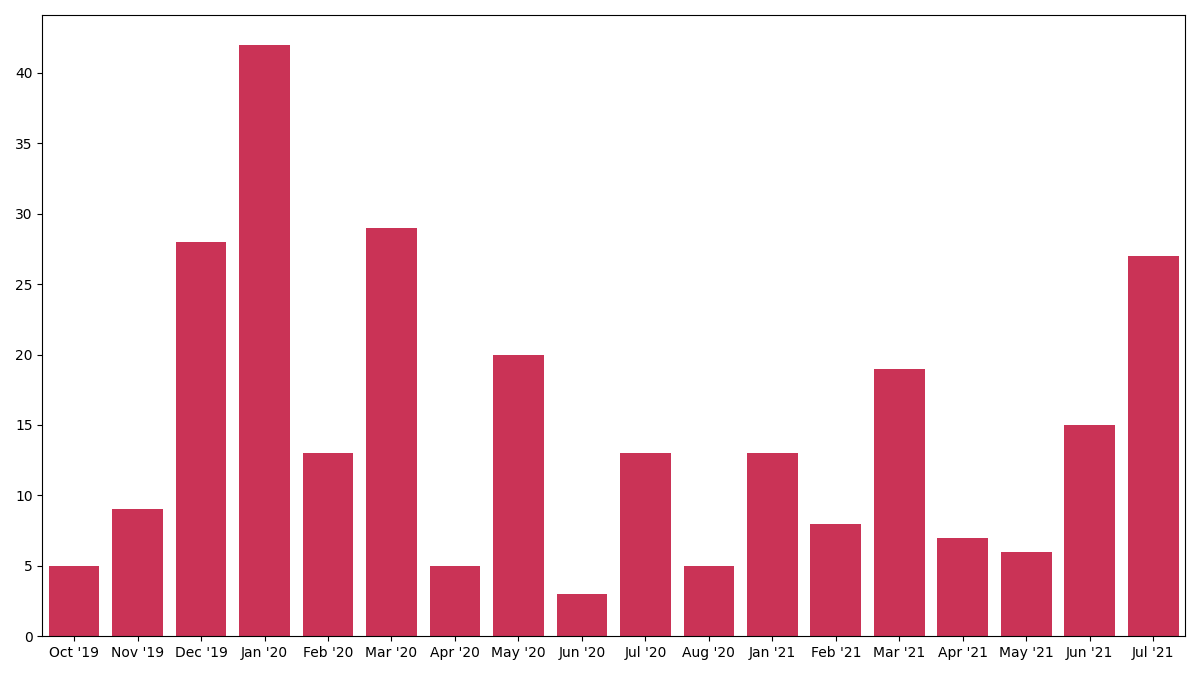
And here’s how much he talks about insider trading (given his Laws of Insider Trading):
And here’s a list of the top 50 topics he has written about, along with a count of how many times the entity was mentioned (at least according to my code):
U.S. (1094), SEC (969), GameStop (793), Elon Musk (767), Goldman Sachs (736), SPAC (570), Robinhood (544), WeWork (542), Bloomberg (530), Federal Reserve (484), Tesla (434), SoftBank (430), China (347), Archegos (316), BlackRock (312), Credit Suisse (298), Reddit (296), ETF (262), AMC (258), Twitter (249), Hertz (245), Adam Neumann (224), Greensill (206), New York (176), U.S. Treasury (168), Bitcoin (156), JPMorgan (152), NFT (139), Morgan Stanley (129), Amazon (125), Wall Street Journal (117), Citi (116), Bill Ackman (108), Deutsche Bank (106), Donald Trump (102), Company (100), XIV (98), Exxon (95), Schwab (93), Libor (86), Vision Fund (84), Kodak (82), Buffett (81), Financial Times (75), NYSE (74), CDS (74), Softbank (72), Congress (71), S&P (71), SPARC (71).
How I did this:
The short version is:
- Download Money Stuff emails using the Gmail API
- Run the Spacy NLP library on it to extract entities
- Plot a heatmap using Seaborn/Matplotlib
- Profit?
The actual source code is at https://github.com/polybuildr/money-stuff so you can play around with it and find some more interesting things. If you’ve been a Money Stuff subscriber for much longer, you could run the same code and see what happens over longer periods of time.
I could add a slightly longer version of the process I used to do this, but in the interest of actually being able to publish some version of this post, I’m going to hold off on that.
Appendix
An HTML table version of the heatmap showing top 10 topics (thanks to DataFrame.to_html). Note that the number themselves don’t mean really anything, it’s their value relative to others that’s interesting.
| 2019-10-01 | 2019-11-01 | 2019-12-01 | 2020-01-01 | 2020-02-01 | 2020-03-01 | 2020-04-01 | 2020-05-01 | 2020-06-01 | 2020-07-01 | 2020-08-01 | 2021-01-01 | 2021-02-01 | 2021-03-01 | 2021-04-01 | 2021-05-01 | 2021-06-01 | 2021-07-01 | |
|---|---|---|---|---|---|---|---|---|---|---|---|---|---|---|---|---|---|---|
| U.S. | 41 | 35 | 43 | 55 | 21 | 108 | 71 | 57 | 35 | 32 | 35 | 49 | 23 | 16 | 40 | 31 | 38 | 40 |
| SEC | 26 | 41 | 66 | 32 | 46 | 45 | 12 | 37 | 44 | 24 | 11 | 56 | 48 | 26 | 37 | 27 | 35 | 37 |
| Goldman Sachs | 21 | 27 | 9 | 109 | 13 | 6 | 19 | 60 | 7 | 19 | 10 | 9 | 38 | 52 | 45 | 11 | 41 | 19 |
| GameStop | 0 | 0 | 0 | 0 | 0 | 0 | 0 | 0 | 0 | 0 | 0 | 112 | 234 | 84 | 21 | 2 | 40 | 7 |
| Elon Musk | 19 | 7 | 28 | 11 | 14 | 0 | 15 | 46 | 4 | 54 | 5 | 36 | 55 | 12 | 28 | 79 | 29 | 41 |
| WeWork | 121 | 93 | 37 | 25 | 16 | 36 | 20 | 8 | 17 | 31 | 0 | 0 | 9 | 17 | 1 | 6 | 0 | 0 |
| Robinhood | 1 | 6 | 20 | 0 | 3 | 25 | 0 | 4 | 21 | 25 | 35 | 66 | 48 | 18 | 2 | 11 | 0 | 114 |
| Federal Reserve | 1 | 4 | 2 | 3 | 3 | 132 | 61 | 46 | 62 | 23 | 8 | 3 | 1 | 0 | 0 | 1 | 14 | 4 |
| SPAC | 0 | 0 | 0 | 0 | 0 | 0 | 0 | 0 | 24 | 64 | 2 | 46 | 35 | 28 | 58 | 42 | 38 | 18 |
| SoftBank | 61 | 60 | 25 | 16 | 32 | 15 | 37 | 14 | 2 | 20 | 0 | 2 | 6 | 5 | 0 | 7 | 0 | 2 |
HTML table version of filtered top 25 heatmap. Once again, the numbers themselves don’t really mean anything.
| 2019-10-01 | 2019-11-01 | 2019-12-01 | 2020-01-01 | 2020-02-01 | 2020-03-01 | 2020-04-01 | 2020-05-01 | 2020-06-01 | 2020-07-01 | 2020-08-01 | 2021-01-01 | 2021-02-01 | 2021-03-01 | 2021-04-01 | 2021-05-01 | 2021-06-01 | 2021-07-01 | |
|---|---|---|---|---|---|---|---|---|---|---|---|---|---|---|---|---|---|---|
| SEC | 26 | 41 | 66 | 32 | 46 | 45 | 12 | 37 | 44 | 24 | 11 | 56 | 48 | 26 | 37 | 27 | 35 | 37 |
| Goldman Sachs | 21 | 27 | 9 | 109 | 13 | 6 | 19 | 60 | 7 | 19 | 10 | 9 | 38 | 52 | 45 | 11 | 41 | 19 |
| GameStop | 0 | 0 | 0 | 0 | 0 | 0 | 0 | 0 | 0 | 0 | 0 | 112 | 234 | 84 | 21 | 2 | 40 | 7 |
| Elon Musk | 19 | 7 | 28 | 11 | 14 | 0 | 15 | 46 | 4 | 54 | 5 | 36 | 55 | 12 | 28 | 79 | 29 | 41 |
| WeWork | 121 | 93 | 37 | 25 | 16 | 36 | 20 | 8 | 17 | 31 | 0 | 0 | 9 | 17 | 1 | 6 | 0 | 0 |
| Robinhood | 1 | 6 | 20 | 0 | 3 | 25 | 0 | 4 | 21 | 25 | 35 | 66 | 48 | 18 | 2 | 11 | 0 | 114 |
| Federal Reserve | 1 | 4 | 2 | 3 | 3 | 132 | 61 | 46 | 62 | 23 | 8 | 3 | 1 | 0 | 0 | 1 | 14 | 4 |
| SPAC | 0 | 0 | 0 | 0 | 0 | 0 | 0 | 0 | 24 | 64 | 2 | 46 | 35 | 28 | 58 | 42 | 38 | 18 |
| SoftBank | 61 | 60 | 25 | 16 | 32 | 15 | 37 | 14 | 2 | 20 | 0 | 2 | 6 | 5 | 0 | 7 | 0 | 2 |
| Tesla | 6 | 2 | 3 | 5 | 32 | 0 | 4 | 17 | 11 | 33 | 5 | 28 | 25 | 5 | 13 | 25 | 15 | 28 |
| BlackRock | 3 | 8 | 10 | 35 | 30 | 6 | 1 | 14 | 12 | 6 | 1 | 4 | 3 | 2 | 20 | 24 | 10 | 19 |
| ETF | 0 | 1 | 0 | 1 | 1 | 91 | 15 | 38 | 0 | 1 | 0 | 0 | 4 | 19 | 0 | 10 | 18 | 0 |
| China | 36 | 1 | 1 | 3 | 6 | 2 | 7 | 8 | 8 | 9 | 20 | 11 | 4 | 0 | 9 | 3 | 0 | 35 |
| 1 | 5 | 0 | 0 | 12 | 1 | 0 | 0 | 0 | 0 | 1 | 36 | 74 | 27 | 4 | 3 | 16 | 0 | |
| Hertz | 0 | 0 | 0 | 0 | 0 | 0 | 0 | 11 | 76 | 0 | 20 | 9 | 0 | 9 | 6 | 15 | 7 | 0 |
| Archegos | 0 | 0 | 0 | 0 | 0 | 0 | 0 | 0 | 0 | 0 | 0 | 0 | 0 | 0 | 65 | 10 | 37 | 36 |
| AMC | 0 | 0 | 0 | 0 | 0 | 0 | 0 | 14 | 0 | 0 | 0 | 9 | 13 | 0 | 0 | 0 | 87 | 18 |
| Credit Suisse | 7 | 0 | 8 | 0 | 6 | 0 | 0 | 10 | 1 | 0 | 0 | 0 | 0 | 3 | 27 | 55 | 6 | 14 |
| U.S. Treasury | 2 | 1 | 7 | 6 | 3 | 29 | 13 | 7 | 6 | 8 | 6 | 2 | 0 | 0 | 2 | 2 | 19 | 0 |
| Greensill | 0 | 0 | 0 | 0 | 0 | 0 | 0 | 0 | 0 | 0 | 0 | 0 | 0 | 51 | 33 | 1 | 9 | 9 |
| JPMorgan | 8 | 3 | 2 | 4 | 5 | 5 | 29 | 0 | 0 | 0 | 2 | 4 | 1 | 0 | 21 | 7 | 0 | 6 |
| Bitcoin | 3 | 0 | 3 | 0 | 5 | 0 | 0 | 2 | 0 | 3 | 4 | 17 | 22 | 1 | 7 | 16 | 4 | 4 |
| NFT | 0 | 0 | 0 | 0 | 0 | 0 | 0 | 0 | 0 | 0 | 0 | 0 | 0 | 17 | 21 | 26 | 10 | 2 |
Number of times he mentions “fraud”:
| 0 | |
|---|---|
| Oct '19 | 12 |
| Nov '19 | 54 |
| Dec '19 | 28 |
| Jan '20 | 36 |
| Feb '20 | 60 |
| Mar '20 | 30 |
| Apr '20 | 39 |
| May '20 | 62 |
| Jun '20 | 72 |
| Jul '20 | 93 |
| Aug '20 | 17 |
| Jan '21 | 75 |
| Feb '21 | 59 |
| Mar '21 | 75 |
| Apr '21 | 50 |
| May '21 | 47 |
| Jun '21 | 30 |
| Jul '21 | 49 |
Number of times he mentions “Insider trading”:
| Month | Count of mentions |
|---|---|
| Oct '19 | 5 |
| Nov '19 | 9 |
| Dec '19 | 28 |
| Jan '20 | 42 |
| Feb '20 | 13 |
| Mar '20 | 29 |
| Apr '20 | 5 |
| May '20 | 20 |
| Jun '20 | 3 |
| Jul '20 | 13 |
| Aug '20 | 5 |
| Jan '21 | 13 |
| Feb '21 | 8 |
| Mar '21 | 19 |
| Apr '21 | 7 |
| May '21 | 6 |
| Jun '21 | 15 |
| Jul '21 | 27 |
-
… for some definition of “top”. I initially just counted the number of occurrences but later on I decided to do some normalization. Look at the How I did this section for details of the actual process. ↩︎
-
I simply had to use footnotes in a post about Money Stuff. ↩︎